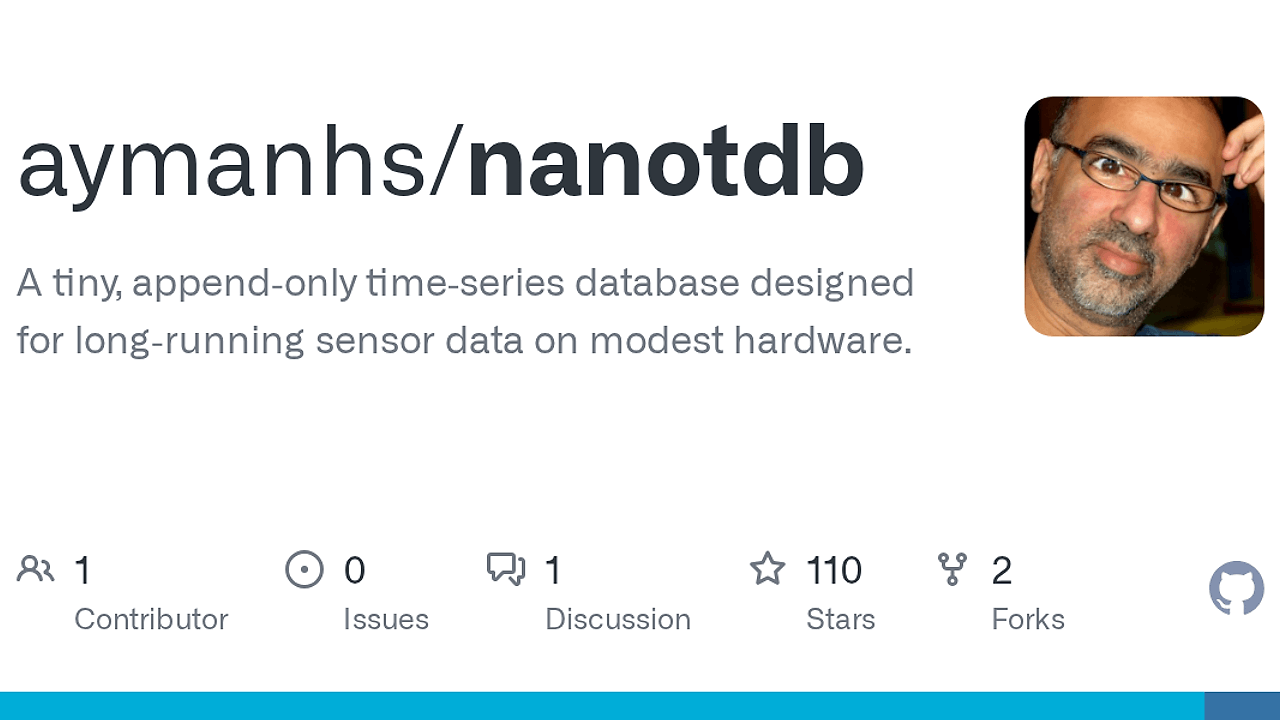
What Is NanoTDB?
NanoTDB is an embedded time-series database built by aymanhs for Raspberry Pi, edge devices, and single-node systems. NanoTDB is one of the best Embedded Time-Series Databases tools for Raspberry Pi users, edge device builders, and single-node operators. The repo ships three official ARM release targets plus nanocli, and it stores metrics as plain files with WAL-backed recovery instead of asking you to run InfluxDB, VictoriaMetrics, or Prometheus alongside extra services.
Quick Overview
| Attribute | Details |
|---|---|
| Type | Embedded Time-Series Databases |
| Best For | Raspberry Pi users, edge device builders, and single-node operators |
| Language/Stack | Single-binary daemon, TOML config, HTTP API, line protocol, WAL-backed plain files |
| License | N/A |
| GitHub Stars | N/A as of Feb 2026 |
| Pricing | Open-Source |
| Last Release | N/A |
Who Should Use NanoTDB?
- Raspberry Pi operators who need local metrics retention on SD or USB storage without a full observability stack.
- Edge device builders who want a daemon that keeps data on the box, survives restarts, and can be inspected from the filesystem.
- Embedded app maintainers who only need a few hundred metrics, not multi-tenant cardinality or remote ingestion pipelines.
- Offline-first teams that prefer
nanoclifor WAL inspection, export, and rollup rebuilds when the server is not running.
Not ideal for:
- Clustered monitoring deployments where horizontal scaling, sharding, or replication are mandatory.
- High-cardinality environments with tens of thousands of series per host.
- Teams that need arbitrary out-of-order writes or a large alerting and visualization ecosystem.
Key Features of NanoTDB
- Plain-file storage layout — NanoTDB keeps the WAL, catalog, manifests, and partitioned
.datfiles in one directory tree. That makes backup, retention, and forensic inspection much easier than opaque block storage. - Built-in WAL recovery — each database has a local
<db>.walfile that replays on restart after a crash or power loss. Recent samples are recovered into the open page state before they are flushed into durable data files. - Engine-owned rollups — hourly and daily summaries live inside the database engine, so you do not need a separate downsampling job or compaction service. That is useful when long-horizon history must stay local.
- Offline CLI workflows —
nanoclican inspect WAL files, export line protocol, and rebuild rollups without a running server. That matters on headless devices where the safest debug path is the filesystem, not a remote dashboard. - Simple retention mechanics — old history maps cleanly to deleting partition files instead of invoking a complex compaction pipeline. For small disks, that keeps operational overhead low and predictable.
- Small-system deployment fit — NanoTDB is designed for Raspberry Pi, edge nodes, appliances, and other resource-constrained hosts. The repo even publishes separate release assets for older ARMv6, ARMv7, and ARM64 targets.
- Direct line-protocol ingestion — samples use
DB/metric.name value [timestamp], so you can push telemetry with a plain HTTP call or any script that can format text. That keeps integration simple for sensors, cron jobs, and embedded services.
NanoTDB vs Alternatives
| Tool | Best For | Key Differentiator | Pricing |
|---|---|---|---|
| NanoTDB | Local metrics on one machine | Plain files, offline inspection, engine-owned rollups | Open-Source |
| InfluxDB | General-purpose time-series with a mature ecosystem | Bigger feature set, broader ecosystem, more mature querying and tooling | Open-Source / Paid |
| VictoriaMetrics | High-ingest metrics backends | Strong compression and Prometheus compatibility at scale | Open-Source / Paid |
| Prometheus | Pull-based monitoring and alerting | De facto service-monitoring standard with scrape and alert workflows | Open-Source |
Pick InfluxDB when you need a broader ecosystem, more established integrations, or a team already invested in its query model. Pick VictoriaMetrics when ingest volume and Prometheus compatibility matter more than inspectable local files, and pick Prometheus when your world is scrape-based service monitoring rather than local data retention.
NanoTDB is the better fit when you want one daemon, one data directory, and a CLI that can recover history without external services. If you also need tracing or service dashboards, pair NanoTDB with OpenTrace for traces and Django Control Room for app-level visibility; if you live in the terminal, browse all CLI Tools is the right companion category.
How NanoTDB Works
NanoTDB uses a local namespace per database, and each database owns its own WAL, catalog, manifest, and partitioned .dat files. The core abstraction is simple: a metric is a single numeric stream with a fixed type for life, and a sample is a line-protocol record in the form DB/metric.name value [timestamp].
Writes land in the WAL first, then move into in-memory open pages, and finally flush into durable page files when size, age, or record thresholds are reached. That means NanoTDB can recover unflushed writes after a crash, while retention still stays simple because old partitions are just files on disk.
The design avoids a separate index service and keeps durability controls explicit in engine.toml. If you want stronger crash safety, you pay with more fsync activity; if you want lower write overhead, you can relax the policy and accept the tradeoff instead of hiding it behind a managed service.
./nanotdb --init --config ~/nanotdb-data/engine.toml
./nanotdb --config ~/nanotdb-data/engine.toml
curl -X POST 'http://localhost:8428/api/v1/import' -d $'demo/room.temp 21.5\ndemo/room.humidity 48'
curl 'http://localhost:8428/api/v1/query?query=demo/room.temp'
./nanocli inspect wal --root ~/nanotdb-data --db demo --verbose
That sequence starts the daemon, inserts two numeric samples, reads one metric back, and inspects the WAL from disk. Expect the first query to return the stored series immediately, and expect nanocli to show you the local recovery state without relying on the server process.
Pros and Cons of NanoTDB
Pros:
- Inspectable storage — WAL, manifests, and data files are ordinary files, so backup and debugging do not require internal admin tooling.
- Offline recovery path —
nanoclican inspect and rebuild state when the main server is offline, which is practical on headless devices. - Good fit for small disks — retention via partition deletion and compressed page files keeps long-running local history manageable.
- Simple integration surface — HTTP import/query endpoints plus line protocol make it easy to script from shell, cron, or firmware.
- No runtime dependency stack — there is no separate index service or external database to keep alive just to read metrics.
- Explicit durability knobs —
wal.fsync_policyanddurability.profilelet you decide where to sit on the safety-versus-throughput curve.
Cons:
- Not distributed — NanoTDB is built for one node, so it is the wrong choice for sharded or replicated monitoring backends.
- Not for extreme cardinality — it is aimed at hundreds of metrics, not massive fleets with wide label explosion.
- No arbitrary out-of-order ingestion — the repo explicitly says that pattern is out of scope, so some telemetry workloads will not fit.
- Smaller ecosystem — compared with InfluxDB or Prometheus, you get fewer integrations, dashboards, and third-party operators.
- Storage tradeoffs are user-visible — you have to understand WAL behavior, flush timing, and fsync policy if you care about crash safety.
Getting Started with NanoTDB
mkdir -p ~/nanotdb-data
# download the release asset that matches your ARM target from GitHub Releases
chmod +x nanotdb nanocli
./nanotdb --init --config ~/nanotdb-data/engine.toml
./nanotdb --config ~/nanotdb-data/engine.toml
curl -X POST 'http://localhost:8428/api/v1/import' -d $'demo/room.temp 21.5\ndemo/room.humidity 48'
curl 'http://localhost:8428/api/v1/query?query=demo/room.temp'
After the daemon starts, it creates the database files under ~/nanotdb-data and begins accepting samples on the local HTTP API. If you want stronger crash protection, set wal.fsync_policy = "always" and durability.profile = "strict" in engine.toml; if you want less write amplification on flash media, move toward the balanced or throughput presets.
Verdict
NanoTDB is the strongest option for local metrics on Raspberry Pi and edge devices when you need inspectable files and offline recovery. Its biggest strength is the file-first storage model with WAL replay, and its main caveat is that it does not try to be a distributed TSDB. Choose NanoTDB when simplicity beats scale.