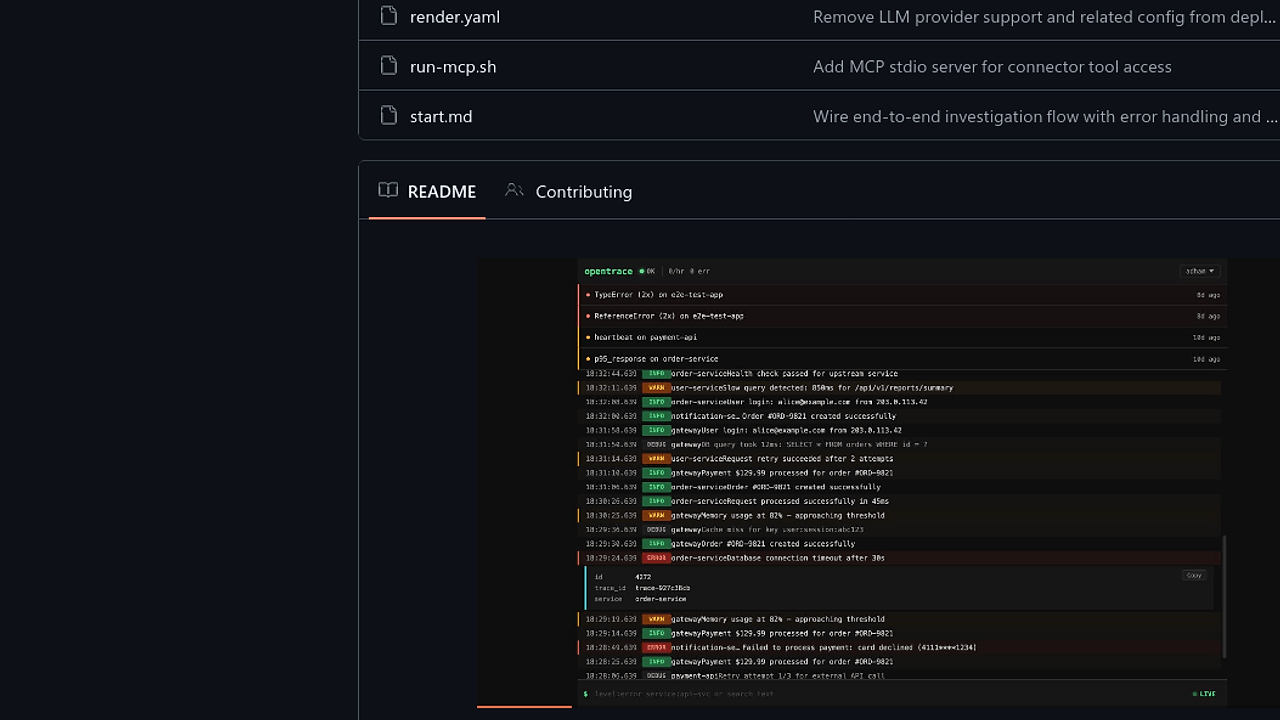
OpenTrace: Killing Copy-Paste Debugging from Cloud Logs
OpenTrace obliterates the ritual of screenshotting stack traces, grep'ing production logs, and manually explaining query plans to AI assistants. It replaces fragmented cloud observability stacks like Datadog or New Relic agents with a self-hosted server that pipes production telemetry straight into MCP clients. Developers waste hours bridging AI tools and runtime data; OpenTrace glues them natively.
Under the Hood: MCP Stdio Server and SQLite Persistence
Core is a Go binary at ./cmd/opentrace exposing an MCP stdio server via opentrace mcp for 75+ tools handling logs, Postgres connections, and server metrics. Data persists in SQLite under /data volume, with optional Postgres migrations ditched for simplicity; Prometheus metrics track HTTP, MCP calls, watchers via go.mod deps like github.com/prometheus/client_golang. Deployment injects version at build time into /api/version; OpenAPI 3.0 Swagger UI documents endpoints. No external LLM providers—pure toolserver over stdio protocol.
The Good & The Bad
Pros:
- Runs anywhere as single binary or Docker image (
ghcr.io/adham90/opentrace:latest), zero infra setup beyond port 8080. - MCP-native design means Claude/Cursor invoke tools like log ingestion or query plans without API glue code.
- Local SQLite storage keeps all traces private, no vendor lock-in or egress fees.
- Prometheus integration for metrics on MCP tools and watchers out-of-box.
- One-click deploys to Fly.io, Railway, Render via
fly.toml/railway.toml. - Browser JS error tracking via
.envconfig.
Cons:
- Locked to linux/amd64 in GoReleaser due to pg_query_go CGO deps—no ARM or Windows natives.
- No multi-tenant support; single-instance SQLite scales poorly past solo dev teams.
- MCP ecosystem immaturity means client compatibility varies—Claude Desktop works, others may flake.
- Recent refactors axed Postgres migrations and LLM configs, breaking old setups.
- 265 commits but sparse issues/pulls signal solo-maintainer risk.
Quickstart
git clone https://github.com/adham90/opentrace.git && cd opentrace
cp .env.example .env
go build -o opentrace ./cmd/opentrace && ./opentrace
Or Docker: docker run -d --name opentrace -p 8080:8080 -v opentrace-data:/data ghcr.io/adham90/opentrace:latest. Hits localhost:8080 for admin setup on first load. Add to .mcp.json: {"mcpServers":{"opentrace":{"type":"stdio","command":"/path/to/opentrace","args":["mcp"]}}}. Query AI: "What errors are happening?"—it pulls live traces via MCP.
Who Should Use This (and Who Shouldn't)
Use it if: Solo devs or indie hackers running AI agents like Claude on self-hosted apps needing prod visibility without SaaS bills; small teams debugging Postgres-heavy stacks via natural queries; Cursor users tired of tab-switching between IDE and logs.
Skip it if: Enterprise scale demanding RBAC or sharding—SQLite chokes; teams on managed K8s wanting Helm charts over ad-hoc tomls; Windows devs, as CGO builds fail cross-platform.
Alternatives & When to Switch
Pick Datadog Agent if you need enterprise alerting and 1000s of hosts—OpenTrace lacks dashboards. Use Grafana Loki for petabyte log volumes with PromQL federation—OpenTrace prioritizes MCP over query power. Switch to SigNoz for full-stack OpenTelemetry if Kubernetes-native tracing trumps AI integration.